It will look like this:
Once the Symptoms and Rubrics have been added to the Analysis, it is time to look at the results.
These results are shown on the right hand side of the window.
There are basically two ways of viewing the analysis result:
- an overview of multiple results, based upon the same analysis.
- a detailed overview of a single analysis result.
The overview of multiple results can be selected. (Toolbar button ![]() ).
).
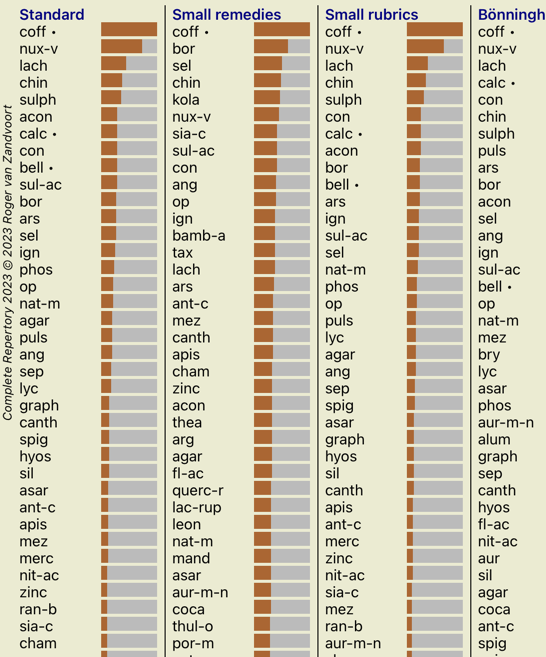
It will look like this:
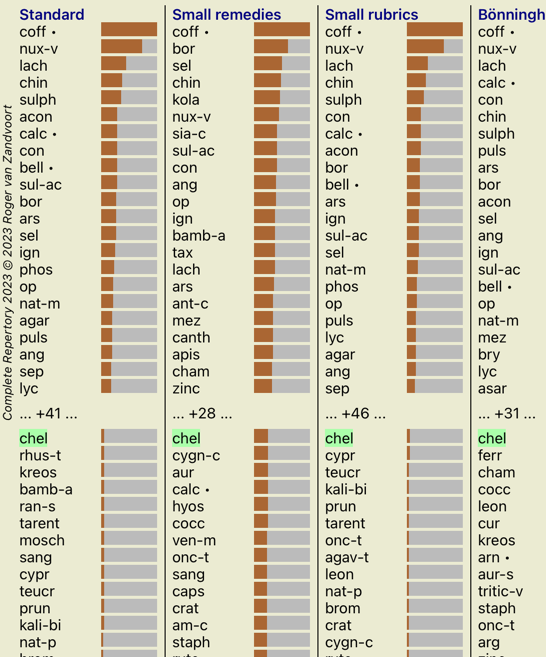
The standard results in this picture mean the following:
Standard This is the standard analysis result, based upon carefully selected parameters. Small remedies Is this result, smaller remedies are given more importance than larger remedies (polychrests). This compensates for the unequal occurrence of remedies throughout the repertory. Polychrests are not left out of the analysis, it is just that their dominance is reduced. Small rubrics In this result, the rubrics with few remedies are given more importance than rubrics with a lot of remedies. This way, more characteric rubrics have more impact on the result than very common rubrics. Bönninghausen In this type of analysis, a remedy is counted based upon its occurrence in related rubrics in the repertory.
Bönninghausen analysis is used mainly with the larger and more generic rubrics. Also, correction for polar rubrics is more important. For more information, see Analysis - Bönninghausen.Simple counting This is a very simple counting, like it was done in the old days with just a pencil and paper. For all rubrics in the analysis, the gradation of all remedies is simply added up.
Maybe you are not always interested in all the standard analysis methods that Complete Dynamics offers you.
You can decide which analyses are shown and in which order they should occur.
You can change this in the Preferences settings. See section Preferences for more information.
When you look at the result in the picture above, you will notice that no numbers are printed whatsoever. All you see is a bar behind every remedy, that shows the relative importance of the remedy. The remedies are sorted in order of importance. The shorter the colored bar, the less important the remedy is in the given result.
If you prefer to see numbers in the result, you can press the toolbar button. (Toolbar button ![]() ).
).
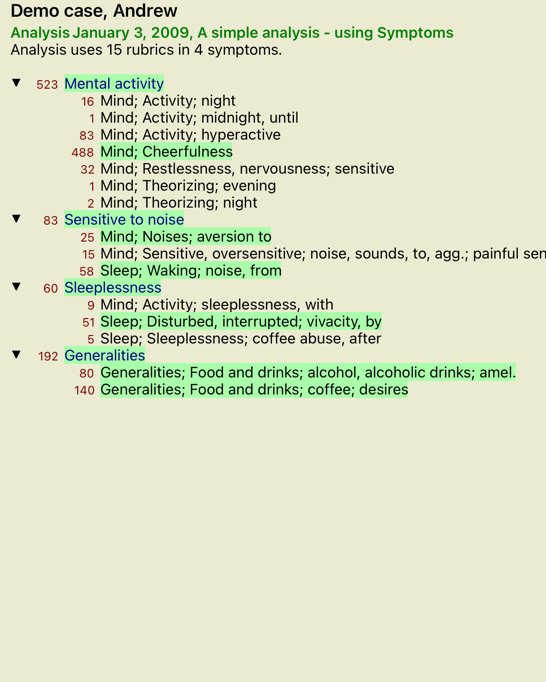
The result will then look like this:
In some situations, you might not want to sort the result in order of importance, but according to the number of symptoms and rubrics a remedy occurs in.
You can then press toolbar button ![]() , meaning 'Sort analysis on number of symptoms/rubrics'. (Toolbar button
, meaning 'Sort analysis on number of symptoms/rubrics'. (Toolbar button ![]() ).
).
It can often be convenient to quickly recognize which remedies have already been prescribed to a patient.
All remedies that have previously been prescribed, are marked with a dot behind the name.
You can quickly see the relationship between rubrics and remedies by clicking on either a rubric, or on a remedy in the result.
The corresponding remedies or rubrics are highlighted then.
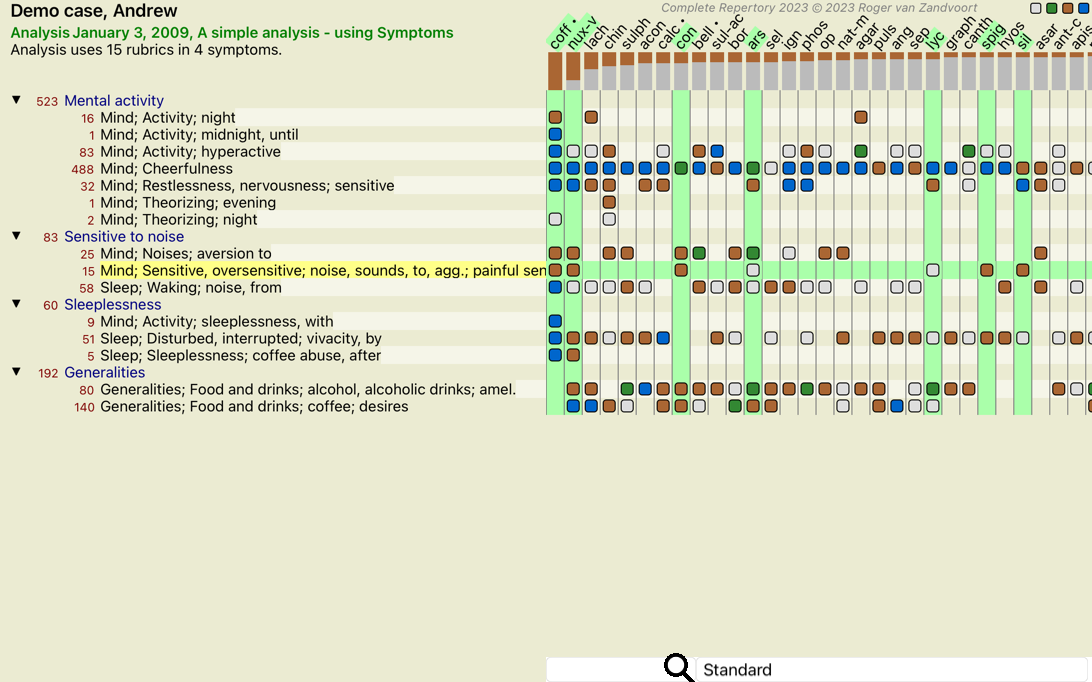
Example: Clicking on rubric Mind; sensitive, oversensitive; noise, to; painfull sensitiveness to will show the following in the result area:
In a glimpse you see which remedies are in that rubric!
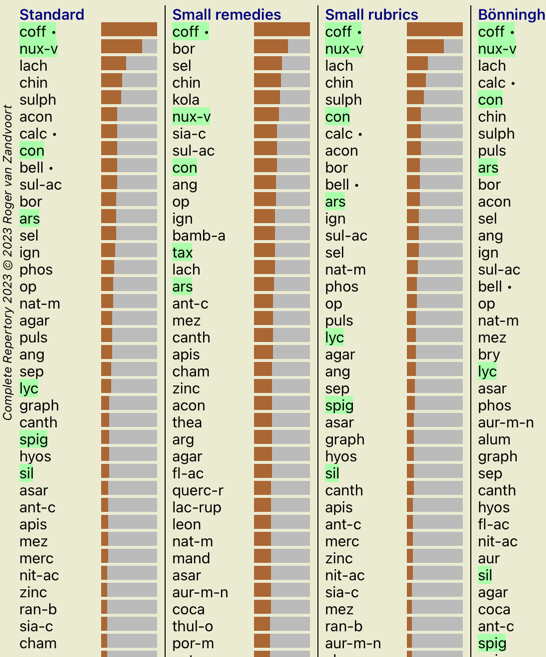
Example: Clicking on remedy sulph will show the following Symptom and Rubric overview:
And in a glimpse you see in which rubrics sulph occurs. Moreover, the selected remedy is highlighted in the other analysis results as well, so you instantly see the relative ranking in the different analyses.
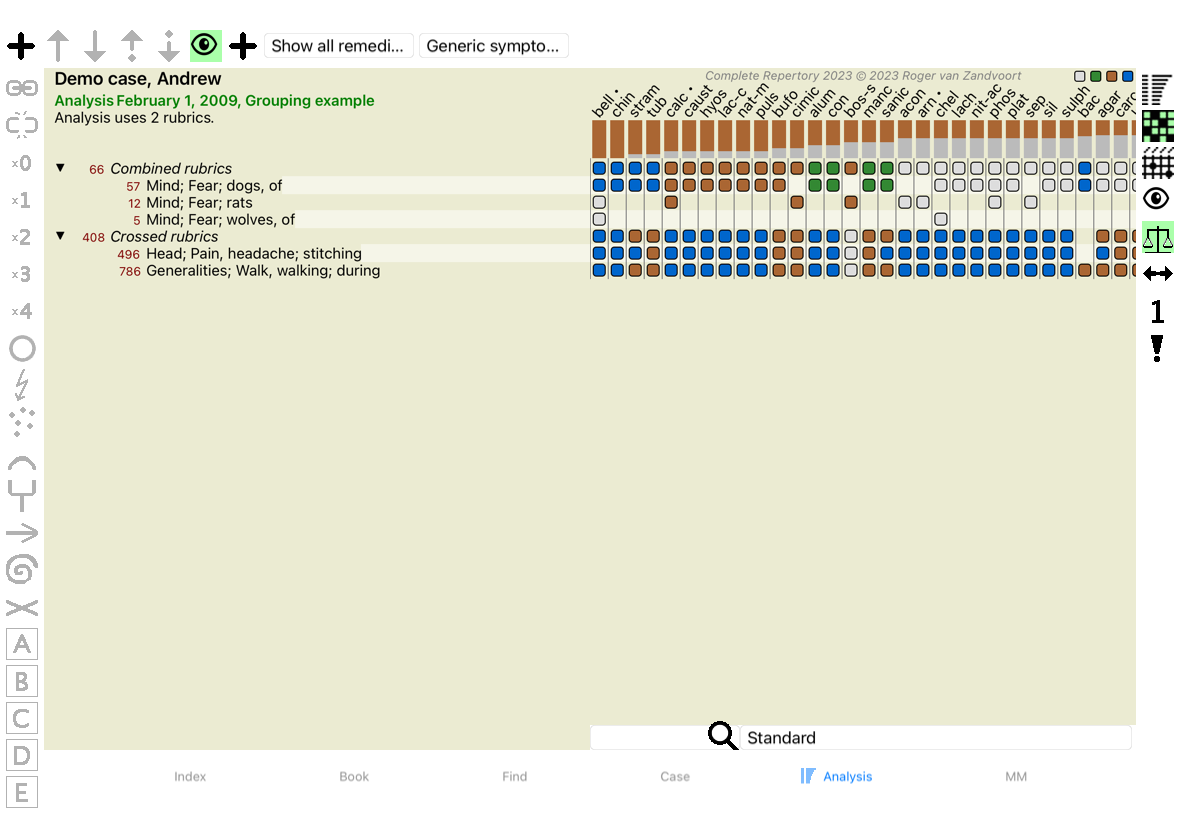
So far for the overview of multiple analyses. Let's now take a look at the detailed overview of a single analysis result...
A more detailed overview of a single analysis can be shown in either the Table or in the Grid view, according to your preference. (Toolbar button ![]() , toolbar button
, toolbar button ![]() ).
).
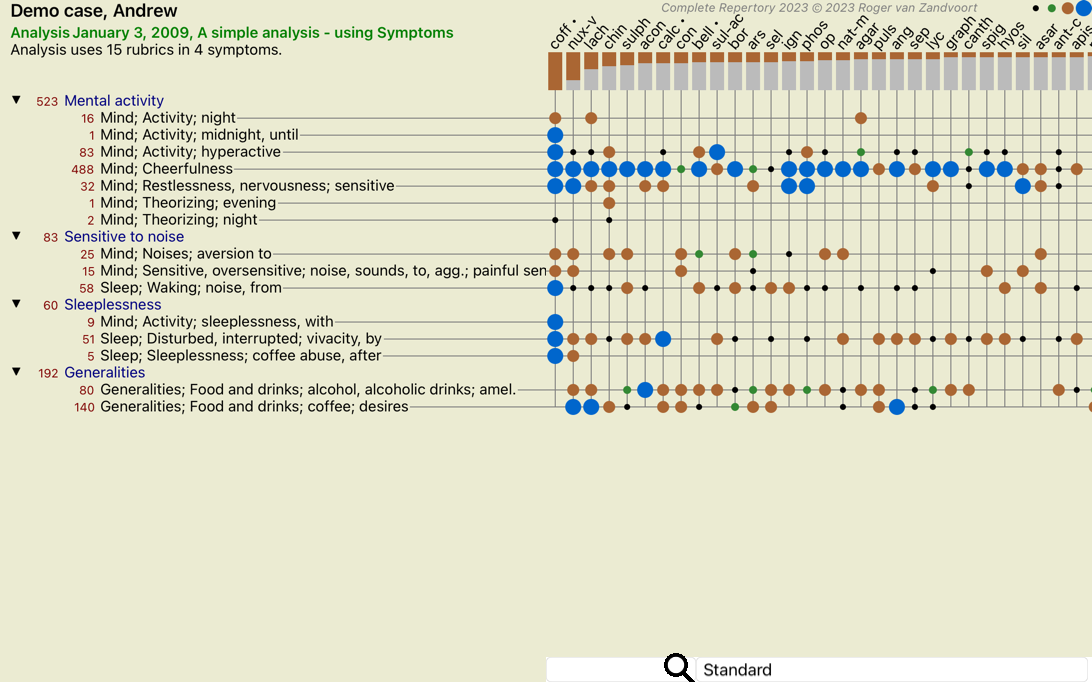
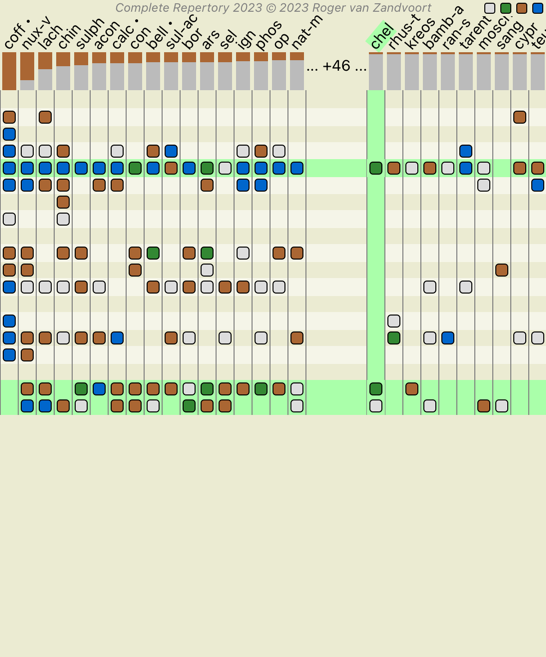
The Table view looks like this:
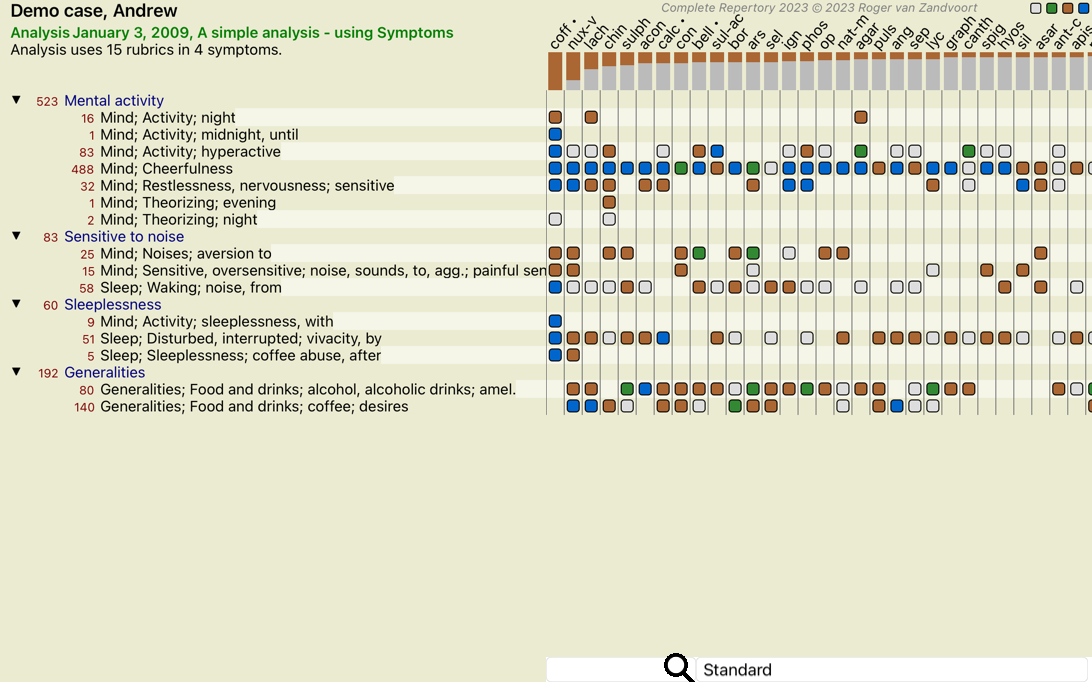
The Grid view looks like this:
This way you get to see the relationship between rubrics and remedies in a single picture. Of course this can only be done for a single analysis.
Below the raster you see a selection box, in which you can switch between the available analysis results.
The blocks or dots indicate that the remedy occurs in a rubric:
Grade 1 Grade 2 Grade 3 Grade 4
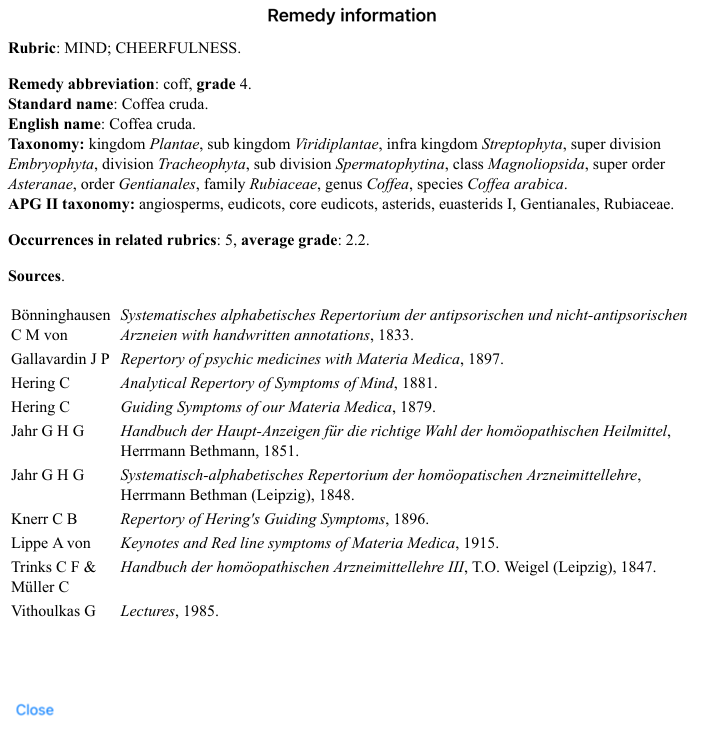
If you want more details, just double click on the bullet to get the complete remedy information:
Also, you can highlight rubrics or remedies by clicking on them:
And of course the toolbar buttons ![]() and
and ![]() can be used to show numbers or change the sorting order.
can be used to show numbers or change the sorting order.
In some situations, you do not just want to see the top results of an analysis, but want to know exactly where a given remedy occurs in those results.
All you have to do is type the abbreviation of the remedy in the Locate remedy field below the analysis results.
The analysis redraws if necessary, skipping part of the results to ensure that your remedy is shown.
The remedy you are looking for is automatically highlighted, to make it better visible for you.
Normally, the analysis results show all remedies.
You can restrict the results to only those remedies that are part of a given Kingdom, Family, or some other group.
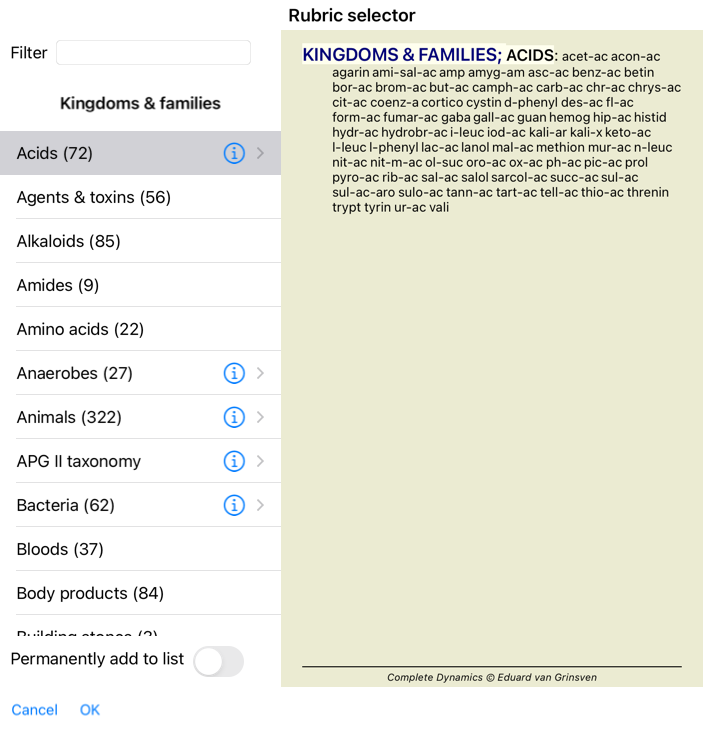
To do this, simply make a selection from the dropdown list in the toolbar:
A number of frequently used groups are predefined (minerals, plants, animals, nosodes). To choose another group, simply select option Other... and a dialog will appear in which you can select one of the groups in the Kingdoms & Families section.
If you check the option Permanently add to list, the group you selected will be added permanently to the standard groups in the list. Next time you start the program, that group will still be in the list. If later you want to remove it, select the same group again via the Other... option, and deselect the option.